Now is a good time to consult data
COVID-19 has confronted the hotel industry with an unprecedented challenge. As governments across the globe began placing limitations on travel at the beginning of 2020 and introducing lockdown measures, hotels started to watch their occupancies and revenues fall off.
In this new COVID-19 business environment, there is no better time to make use of hotel data to be prepared when recovery comes. But hotel industry data alone no longer guarantees you an advantage over your competitors. The longer the pandemic stays around, the more you will need to leverage current data that can help you understand your performance in relation to the industry or market to improve strategy and that’s where benchmarking can help.
WHAT IS BENCHMARKING?
Benchmarking is a process by which you can measure your hotel’s performance or data against other similar hotels using specific metrics or KPI’s to discover if there is a gap and identify areas for improvement. You may think your hotel has enjoyed a positive month without realising that other similar rated hotels in the same city performed much better than you. The power of benchmarking resides in the context it offers around your performance.
WHAT ARE THE MOST IMPORTANT METRICS I SHOULD BE FOCUSING ON RIGHT NOW?
If you’re not familiar with Google Analytics, it can be a little daunting at first. With so much data available to dig through, it’s hard to know where to look to find the most important KPI’S in the hotel industry, but for marketers that want to better understand their audience and inform and enhance their marketing strategy, utilising such data is essential, now more than ever. You can start with just a couple of key metrics to focus on right now.
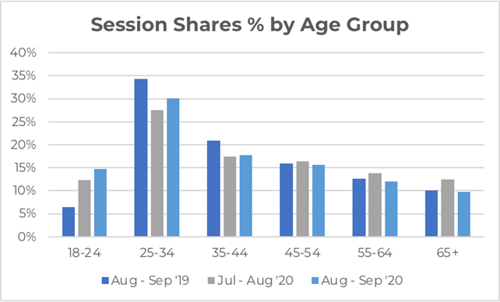
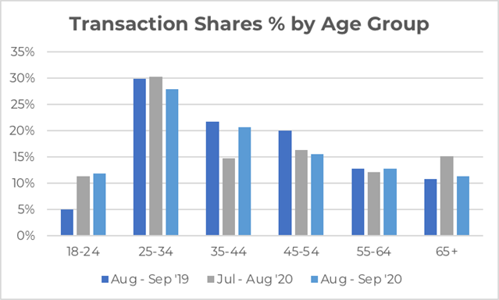
AGE DEMOGRAPHICS
From a recent study by 80 DAYS into London booking trends we see that the most buoyant age demographics for website traffic and bookings has been the 18-44 categories. To make the most efficient use of your digital marketing budgets, you could adjust your demographic targeting to focus on this audience as a priority.
Similarly using Google Analytics to uncover which international markets are performing better, can help you create separate campaigns for those countries with higher bids, while isolating or bidding down those countries or regions that are underperforming for your hotel presently.
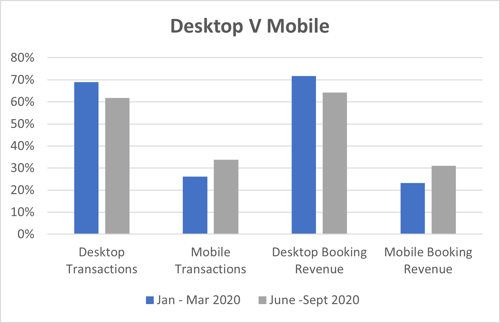
MOBILE CONVERSION RATE
During the pandemic and more importantly, post-lockdown we have seen an accelerated adoption of mobile devices for both browsing and booking. An increase in last minute bookings as well as the changing age demographics (that we looked at earlier) towards a younger audience representing a higher percentage of total travellers continues to drive this.
From a practical perspective and applying this data to your own digital marketing strategies, consider some of the following:
- Evaluate the usability of your hotel website on smartphones
- Look at what may be a barrier to a visitor converting on your site
- Think about adding mobile only rates to push on mobile ads
- Use ‘near me’ campaigns to help drive last-minute bookings for both restaurant and rooms
- Local search ads also provide an opportunity to show adverts to people near your location on their mobile devices
BOOKING ENGINE CONVERSION RATE
An often talked about KPI in the hotel industry is booking engine conversion rate with an average of around 2% often quoted as a hospitality industry benchmark. This 2% represents bookings made relative to the total number of sessions to a hotel website. Interpreting what represents a good conversion rate can prove quite difficult, in particular for independent hotels who might not have access to hotel industry data to compare their performance against. In a recent study undertaken by h2c, evaluating responses and data from 76 small, medium and large hotel chains during 2019 they determined that the average website conversion rate for a hotel group was 1.9% and the booking engine conversion rate was 6.8%. This is the percentage of those who navigated to the booking engine that resulted in a transaction. As you might expect, once a website visitor navigates to the booking engine, the inclination to book is increased. In data from Hotel Benchmark for 2019, it was shown that the average booking engine conversion rate of independent hotels was 3.28%. Booking engine conversion was at its highest in December 2019, achieving 3.72%. Again how can you apply this knowledge if your booking engine conversion rate is less than either the group or independent hotel averages? It might be time to look at your booking process to determine whether a complicated checkout process with multiple forms and massive personalisation could be deterring visitors from completing their purchase on your site. Is your imagery current? And are you still promoting non-refundable rates which is certain to deter customers in this challenging time.
SO WHY AREN’T WE SPENDING ON DATA?
Typically, a third of a hotel’s digital marketing spend goes towards the build and upkeep of their website, and just over half the budget is spent on advertising, with very little being spent on measuring hotel performance or analysing the data. One factor that may explain this is access to free tools like Google Analytics, but would it surprise you to learn that many hotels still spend very little time examining their hotel data to inform critical marketing decisions.
Make sure you are not left behind! Please get in touch with one of the team at Hotel Benchmark if you would like to know more about Hotel Benchmark our hotel database or to sign up just click here.
Categories:

Katrina has been working in the hospitality industry since 1993, more recently at Hotel Benchmark, uncovering insight from a wealth of data.

