It's a wrap
It's a wrap
Analysing the data from over 600 hotels, we look back on last year and summarise a few of the trends we saw impacting the website and digital marketing performance of our community in 2021.

After yet another rollercoaster year for the travel industry in 2021, we remain cautiously optimistic for 2022. With increased vaccination rates and pent up demand, let’s hope this is the year we see travel bounce back.
MOBILE CONTINUES TO DOMINATE
Whether it is for browsing or transacting, customers are increasingly favouring mobile devices. Local search now accounts for between 15-20% of all visits to hotel websites and with mobile devices predominantly used to search for hotels or restaurants ‘near me’ we cannot underestimate it’s contribution to mobile browsing.
Between January and December 2021, mobile sessions (as a %) contribution of overall website sessions grew by 8% with peaks in the summer and again in December.
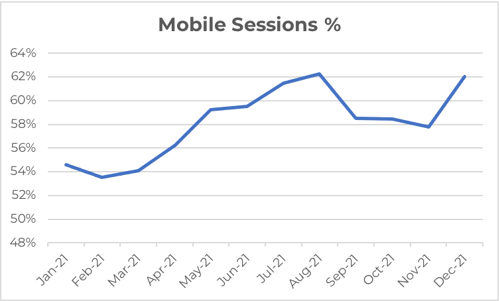
As mobile sessions increase it is only natural that desktop sessions should decrease. We saw a decline in desktop sessions from 42% in January 2021 to 35% in December with % contribution of sessions from tablets staying roughly the same over the twelve month period. Hotel operators have understood the increasing opportunity that mobile commerce offers and have continued to increase investment and implement multi-device strategies to better engage customers throughout their journey as customers continue to switch between devices.
As mobile sessions have increased so too have mobile transactions which now accounts for 37% of total transactions on-line for hotels. We looked at the monthly averages across all of our sample data during 2021 which saw an increase of 7%, peaking at 37% of total transactions in December 2021. There are notable regional differences. The Middle East and in particular Saudi Arabia have much higher mobile transaction rates. In February, 65% of bookings came from mobile devices, similarly customers in the UAE prefer to transact on mobile devices.
CONVERSION RATES ARE IMPROVING
We have seen a steady uptick in conversion rates from the start of 2021 with the biggest step between January and February and a steady increase thereafter. Conversion rate is a commonly used metric to measure and evaluate a hotel’s digital marketing performance and the all too frequently asked question…‘what is a good conversion rate?’ is a challenging one to answer with so many variables involved. Location, star rating, independent v chain are just a few of the factors that come into play.
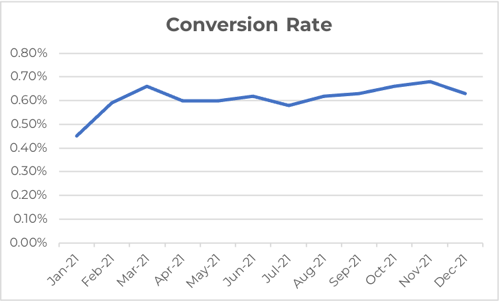
While the average conversion rate for our global community hovered around the 0.6% mark during 2021, in the UAE, the rate was much higher at between 1.4% and 1.5%, while in Asia the average conversion rate for hotels was around 0.1%
How does your conversion rate compare? Use our handy snapshot to see how your website compares, using data from over 600+ hotels in 2021.
Categories:

Katrina has been working in the hospitality industry since 1993, more recently at Hotel Benchmark, uncovering insight from a wealth of data.

