DACH Region Market Report
In this latest article we analyse the performance of hotels in Germany, Austria and Switzerland using aggregated data from our Hotel Benchmark community to compare pre- and post-pandemic (2019 v 2022) hotel results along with individual country performance.

As the hotel industry continues to manage the aftermath of the pandemic alongside staff shortages and inflation, we take a look at how the war in Ukraine may also be having an impact on hotel performance in the DACH region. In this latest article we analyse the performance of hotels in Germany, Austria and Switzerland using aggregated data from our Hotel Benchmark community to compare pre- and post-pandemic (2019 v 2022) results along with individual country performances.
SESSIONS
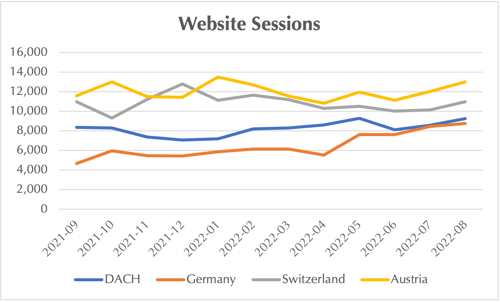
The total number of visits/sessions to your hotel website is a key metric to measure as it can help evaluate whether your marketing and SEO campaigns are effective in driving more traffic. In 2019 the average monthly website sessions for the 4- and 5-star category in the DACH region was 5681 compared to 7677 for 2022 (YTD), a 35% increase.
When looking at specific country performance for average monthly website sessions over the last 12 months, hotels in Austria have enjoyed above average performance for the region, followed by Switzerland and Germany.
TRANSACTIONS
Analysing performance in the region using website transactions as a metric, hotels in Austria out-performed hotels in Germany and Switzerland between September 2021 and February 2022. From March, hotels in Germany and Switzerland enjoyed more transactions via their hotel websites.
Comparing average monthly transactions for hotels within the DACH region in 2019 with 2022, properties have enjoyed almost a 12% increase, with transactions growing from and average of 68 each month to 76.
![]()
CONVERSION
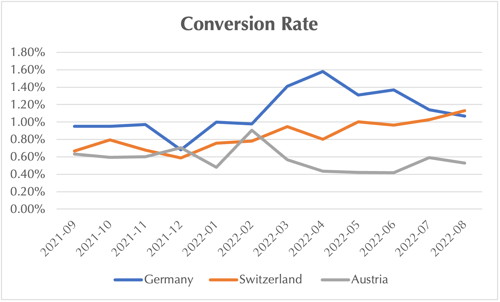
Conversion rate is another key metric to measure over time, when evaluating your hotel's direct channel perofrmance. Conversion rate shows the percentage of visitors to your website who then went on to make a reservation (transaction). Hotels in Germany have achieved higher conversion rates than their counterparts in Switzerland and Austria consistently over the last 12 months.
While hotels in Germany and Switzerland have seen conversion rates increasing steadily – hotels in Germany enjoying conversion rates between 0.95% and 1.07% over the last 12 months and Switzerland hotels an average conversion rate between 0.67% and 1.13%, conversion rates for hotels in Austria have decreased 10% from 0.63% to 0.53%.
BOOKING ENGINE CONVERSION RATE
Data from hotels within the Hotel Benchmark community shows how the booking engine conversion rate has changed over the last 12 months . The Booking Engine Conversion Rate is the percentage of visitors who made a reservation after visiting a hotel website’s booking engine. i.e. visitors that are further down the booking funnel.
The chart below shows the average monthly booking engine conversion rate for all hotels within the DACH region.
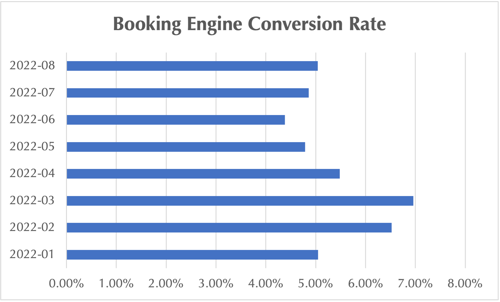
While hotels saw an initial increase at the start of 2022, a decrease followed between April and June, increasing again in July and August this year, with an overall decrease of just 0.01% from the start of the year.
DESKTOP V MOBILE
Comparing device data for hotels websites in Germany, Switzerland and Austria over the last 12 months, mobile accounted for the highest percentage of sessions particularly for hotels in Austria where it has consistently been at 55% or more of total sessions.
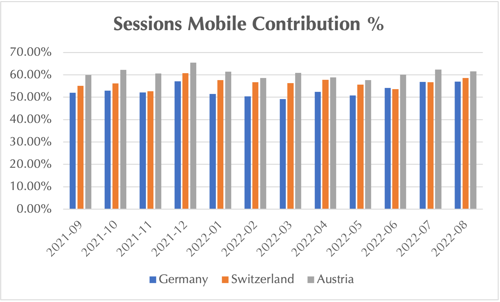
While, mobile represents the highest percentage of traffic, desktop continues to be the preferred device to make accommodation bookings with 77% of customers preferring to transact on desktop devices within the DACH region over the last 12 months.
In Germany, the percentage of transactions carried out on a mobile device has increased by 15% since September, 2021, in Switzerland by 4% and in Austria by 13%.
![]()
Understanding your hotel’s website and digital marketing performance in the context of your market or competitor set is easy with Hotel Benchmark. Signing up only takes a few minutes and users have access to their own dashboard to create, view and download reports.
Categories:

Katrina has been working in the hospitality industry since 1993, more recently at Hotel Benchmark, uncovering insight from a wealth of data.

